Amyvid Injection Dosage
Generic name: FLORBETAPIR F-18 51mCi in 1mL
Dosage form: injection, solution
Drug class: Diagnostic radiopharmaceuticals
Medically reviewed by Drugs.com. Last updated on Jul 9, 2025.
Radiation Safety - Drug Handling
Handle AMYVID with appropriate safety measures to minimize radiation exposure during administration. Use waterproof gloves and effective radiation shielding, including syringe shields when handling and administering AMYVID.
Radiopharmaceuticals, including AMYVID, should be used by or under the control of healthcare providers who are qualified by specific training and experience in the safe use and handling of radionuclides, and whose experience and training have been approved by the appropriate governmental agency authorized to license the use of radionuclides.
Recommended Dosage and Administration Instructions
Recommended Dosage
The recommended amount of radioactivity of AMYVID is 370 MBq (10 mCi) in a total volume of up to 10 mL, administered as a single intravenous bolus. The maximum mass dose is 50 mcg. Follow the injection with an intravenous flush of approximately 10 mL of 0.9% sodium chloride injection.
Patient Preparation
Instruct patients to hydrate before and after AMYVID administration and to void following AMYVID administration before imaging and frequently thereafter.
Administration
- Use aseptic technique and radiation shielding when withdrawing and administering AMYVID.
- Visually inspect AMYVID for particulate matter and discoloration prior to administration. Do not use AMYVID if it contains particulate matter or if it is discolored.
- Do not dilute AMYVID.
- Assay the dose in a dose calibrator prior to administration.
- Inject AMYVID through a short intravenous catheter (approximately 1.5 inches or less) to minimize the potential for adsorption of the drug to the catheter. Portions of the AMYVID dose may adhere to longer catheters.
- Dispose of unused product in a safe manner in compliance with applicable regulations.
Image Acquisition Instructions
- Position the patient supine with the head positioned to center the brain, including the cerebellum, in the PET scanner field of view. Tape or other flexible head restraints may be employed to reduce head movement.
- Acquire 10-minute PET images starting 30 minutes to 50 minutes after AMYVID administration.
- Image reconstruction should include attenuation correction with resulting transaxial pixel sizes between 2 mm and 3 mm.
Image Display and Interpretation
Image Display
- Display images in the transaxial orientation with access as needed to the sagittal and coronal planes.
- In reviewing the images, include all transaxial slices of the brain using a black-white scale set to the maximum intensity of all the brain pixels.
- Initially locate the brain slice with the highest levels of image contrast (highest signal intensity) and adjust the contrast appropriately.
- Start image interpretation by displaying slices sequentially from the bottom of the brain to the top. Periodically refer to the sagittal and coronal plane image display as needed to better define the signal intensity and to ensure that the entire brain is displayed.
Visual Assessment
AMYVID images should be interpreted only by readers who successfully complete the training program provided by the manufacturer.
Perform image interpretation independently of the patient's clinical features, relying on the recognition of unique image features.
Interpret AMYVID images based upon the distribution of signal intensity within the cerebral cortex by comparing the signal intensity in the cortical gray matter and the adjacent white matter. The signal intensity in the cerebellum does not contribute to the scan interpretation. For example, a positive scan may show retained cerebellar gray-white contrast even when the cortical gray-white contrast is lost.
Some scans may be difficult to interpret due to image noise, atrophy with a thinned cortical ribbon, or image blur. For cases where there is uncertainty as to the location of cortical signal, use co-registered anatomical imaging to improve localization of signal.
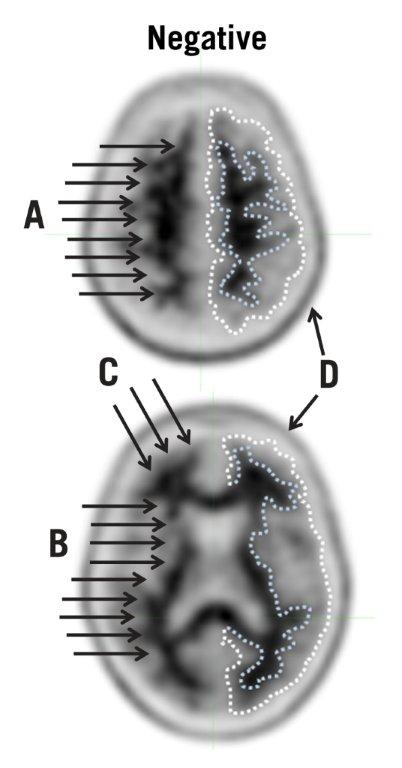
Negative AMYVID Scan
Negative scans show more signal in white matter than in adjacent cortical gray matter, creating clear gray-white contrast.
A negative scan indicates sparse to no amyloid beta neuritic plaques. In patients being evaluated for AD and other causes of cognitive decline who have not been treated with amyloid beta-directed therapy, a negative scan is inconsistent with a neuropathological diagnosis of AD at the time of image acquisition and reduces the likelihood that a patient's cognitive impairment is due to AD. A negative scan result does not preclude the accumulation of amyloid beta in the brain in the future.
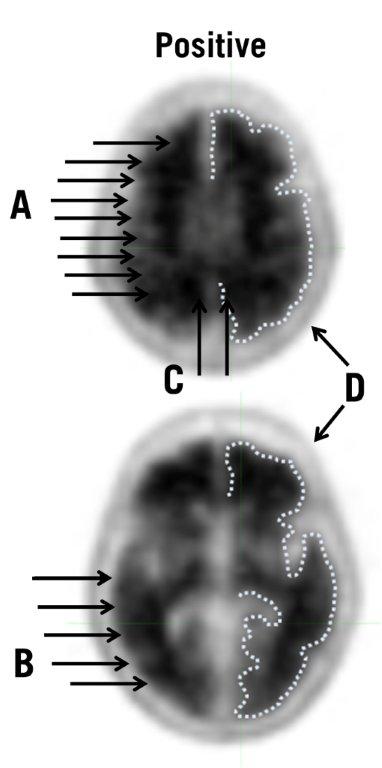
Positive AMYVID Scan
Positive scans show cortical areas with reduction or loss of the normally distinct gray-white contrast. These scans will have one or more areas with increased cortical gray matter signal which results in reduced (or absent) gray-white contrast. Specifically, a positive scan will have either:
- a)
- Two or more brain areas (each larger than a single cortical gyrus) in which there is reduced or absent gray-white contrast. This is the most common appearance of a positive scan.
or - b)
- One or more areas in which cortical gray matter signal is intense and clearly exceeds the signal in adjacent white matter.
A positive scan establishes the presence of moderate to frequent amyloid beta neuritic plaques. Neuropathological examination has shown that moderate to frequent amyloid beta neuritic plaques are present in patients with AD, but may also be present in patients with other types of neurologic conditions as well as older people with normal cognition.
Figures 1, 2, and 3 provide examples of negative and positive scans.
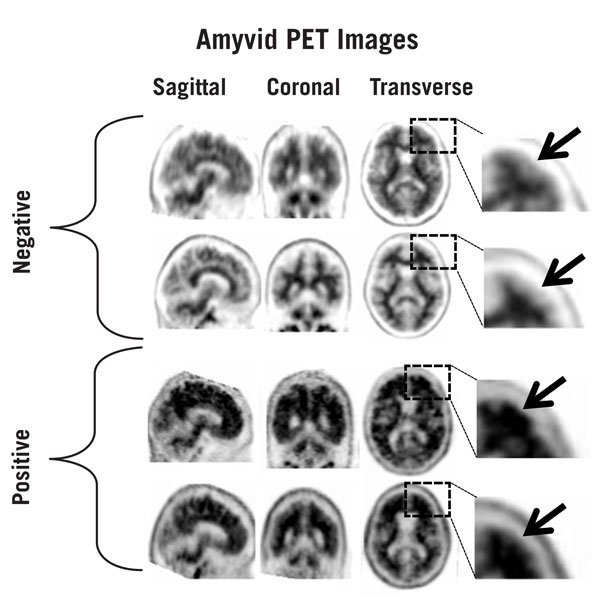
Figure 1: Examples of AMYVID negative scans (top two rows) and positive scans (bottom two rows). Left to right panels show sagittal, coronal, and transverse PET image slices. Final panel to right shows an enlarged picture of the brain area under the box. The top two arrows are pointing to normal preserved gray-white contrast with cortical signal intensity less than the adjacent white matter. The bottom two arrows indicate areas of decreased gray-white contrast with increased cortical signal intensity that is comparable to the intensity in the adjacent white matter.
Quantitative Analysis
Quantification of amyloid beta neuritic plaque levels (e.g., Centiloid scale or standardized uptake value ratio (SUVR)) can be used in conjunction with visual assessment and performed with FDA-authorized software indicated for quantification of brain amyloid beta PET scans. Refer to the drug manufacturer's training materials for qualitative and quantitative assessment and software manufacturers' documentation for software operation.
Radiation Dosimetry
Estimated radiation absorbed doses for adults from intravenous injection of AMYVID are shown in Table 1.
| ORGAN/TISSUE | MEAN ABSORBED DOSE PER UNIT ADMINISTERED ACTIVITY (microGy/MBq) |
| Adrenal | 14 |
| Brain | 10 |
| Breasts | 6 |
| Gallbladder Wall | 143 |
| Heart Wall | 13 |
| Kidneys | 14 |
| Liver | 64 |
| Lower Large Intestine Wall | 28 |
| Lungs | 9 |
| Muscle | 9 |
| Osteogenic Cells | 28 |
| Ovaries | 18 |
| Pancreas | 14 |
| Red Marrow | 14 |
| Skin | 6 |
| Small Intestine | 66 |
| Spleen | 9 |
| Stomach Wall | 12 |
| Testes | 7 |
| Thymus | 7 |
| Thyroid | 7 |
| Upper Large Intestine Wall | 74 |
| Urinary Bladder Wall | 27 |
| Uterus | 16 |
| Total Body | 12 |
| Effective Dose (microSv/MBq) | 19 |
The whole-body effective dose resulting from administration of 370 MBq (10 mCi) of AMYVID to an adult is estimated to be 7 mSv. When PET/CT is performed, exposure to radiation will increase by an amount dependent on the settings used in the CT acquisition.
More about Amyvid (florbetapir F 18)
- Compare alternatives
- Side effects
- During pregnancy
- FDA approval history
- Drug class: diagnostic radiopharmaceuticals
- Breastfeeding
- En español
Patient resources
Professional resources
Related treatment guides
See also:
Further information
Always consult your healthcare provider to ensure the information displayed on this page applies to your personal circumstances.