Vizamyl Dosage
Generic name: Flutemetamol F-18 4.05mCi in 1mL
Dosage form: injection
Drug class: Diagnostic radiopharmaceuticals
Medically reviewed by Drugs.com. Last updated on Aug 1, 2025.
Radiation Safety - Drug Handling
Handle VIZAMYL with appropriate safety measures to minimize radiation exposure during administration. Use waterproof gloves and effective radiation shielding, including lead-glass syringe shields when handling and administering VIZAMYL.
Radiopharmaceuticals, including VIZAMYL, should be used by or under the control of healthcare providers who are qualified by specific training and experience in the safe use and handling of radionuclides, and whose experience and training have been approved by the appropriate governmental agency authorized to license the use of radionuclides.
Recommended Dosage and Administration Instructions
Recommended Dosage
The recommended amount of activity of VIZAMYL is 185 MBq (5 mCi) in a total volume of up to 10 mL, administered as a single intravenous bolus within 40 seconds. The maximum mass dose is 20 mcg. Follow the injection with an intravenous flush of 5 mL to 15 mL of 0.9% sodium chloride injection.
Patient Preparation
Instruct patients to hydrate before and after VIZAMYL administration and to void frequently following VIZAMYL administration to reduce radiation exposure.
Administration
- Use aseptic technique and radiation shielding to withdraw and administer VIZAMYL.
- Visually inspect VIZAMYL for particulate matter and discoloration prior to administration. Do not use VIZAMYL if it contains particulate matter or if it is discolored.
- Do not dilute VIZAMYL.
- Calculate the necessary volume to administer based on calibration time and required dose.
- Measure the activity of VIZAMYL with a dose calibrator immediately prior to administration to the patient.
- Dispose of unused product in a safe manner in compliance with applicable regulations.
Image Acquisition Instructions
- Position the patient supine with the head positioned to center the brain, including the cerebellum, within a single field of view. The patient's head should be tilted so that the anterior commissure-posterior commissure (AC-PC) plane is at right angles to the bore-axis of the PET scanner, with the head positioned in a suitable head support. Tape or other flexible head restraints may be employed to reduce head movement.
- Acquire 10-minute to 20-minute PET images starting 60 minutes to 120 minutes after VIZAMYL administration using a PET scanner in 3-D mode with appropriate data corrections.
- Iterative or filtered back-projection reconstruction is recommended with a slice thickness of 2 mm to 4 mm, and matrix size of 128 × 128 with pixel sizes of approximately 2 mm. Where a post-smoothing filter is applied, full width at half maximum (FWHM) of not more than 5 mm is recommended; filter FWHM should be chosen to optimize the signal-to-noise ratio while preserving the sharpness of the reconstructed image.
Image Orientation and Display
Image Orientation
Orient axial and coronal images to show symmetry of brain structures, with equal heights of structures bilaterally. Orient sagittal images so that the head and neck are neither flexed nor extended; the anterior and posterior aspects of the corpus callosum should be parallel to the AC-PC line as shown in Figure 2.
Image Display
- Display images with all planes (axial, sagittal, and coronal planes) linked by crosshairs.
- Select a color scale that provides a progression of low through high intensity (e.g., rainbow or Sokoloff). The selected color scale should: (1) provide colors that allow the reader to discriminate signal intensity above and below the signal intensity of the pons; (2) provide a color for regions with little or no amyloid binding such as the cerebellar cortex; and (3) provide a range of at least five distinct colors above 50% to 60% of the peak signal intensity.
- Display the reference scale. Adjust the color scale to set the pons to approximately 90% maximum signal intensity. The cerebellar cortex should represent approximately 20% to 30% of peak signal intensity on both negative and positive VIZAMYL scans.
- Display axial brain slices sequentially from the bottom of the brain to the top and look for signs of atrophy.
- Systematically review signal intensity in the following brain regions (recommended plane) for image interpretation:
- Frontal lobes (axial, with optional sagittal plane view)
- Posterior cingulate and precuneus (sagittal, with optional coronal plane view)
- Lateral temporal lobes (axial, with optional coronal plane view)
- Inferolateral parietal lobes (coronal, with optional axial plane view)
- Striatum (axial, with optional sagittal plane view)
Image Interpretation
Visual Assessment
VIZAMYL images should be interpreted only by readers who successfully complete the training program provided by the manufacturer.
Perform image interpretation independently of the patient's clinical features, relying on the recognition of unique image features.
Interpret VIZAMYL images based upon the distribution of signal intensity within the cerebral cortex by comparing the signal intensity in the cortical gray matter and the adjacent white matter, or based on the signal intensity in the five regions mentioned above. The signal intensity in the cerebellum does not contribute to scan interpretation. For example, a positive scan may show retained cerebellar gray-white contrast even when the cortical gray-white contrast is lost. Among patients with clinically important amyloid beta neuritic plaques in the brain, the temporal lobes, parietal lobes, and striatum may not be as affected compared to other brain regions. Therefore, in some images, the signal in these regions may not be as intense as in the frontal lobes or the posterior cingulate and precuneus regions.
Some scans may be difficult to interpret due to image noise, suboptimal patient positioning, or over-smoothing of the reconstructed image. Atrophy may affect the interpretability of scans, particularly in the frontal, temporal, and parietal lobes. Other factors that may affect the ability to interpret VIZAMYL images include patient factors such as brain pathology, surgical changes, post-radiation therapy changes, and implants. For cases in which atrophy is apparent or suspected and there is uncertainty as to the location of the gray matter on the PET scan, examine the striatum for VIZAMYL signal as it is less affected by atrophy than other regions of the brain. If the patient's MRI or CT brain images are available, examine the CT or MRI images to clarify the relationship between VIZAMYL signal and gray matter anatomy.
Negative VIZAMYL Scan
Negative scans show more signal in white matter than in gray matter, creating clear gray-white matter contrast.
Specifically, a negative scan would have the following characteristics:
- frontal, lateral temporal, and inferolateral parietal lobes: gradual gradient from bright intensity of the white matter to lower intensity at the periphery of the brain; distinct sulci with concave surfaces (white matter sulcal pattern),
and
posterior cingulate and precuneus: gray matter uptake below 50% to 60% of peak intensity; gap of lower intensity separates two hemispheres on coronal view,
and
striatum: approximately 50% of peak intensity or lower in the region between the higher intensities of the thalamus and frontal white matter (striatal "gap").
A negative scan indicates sparse to no neuritic plaques. In patients being evaluated for AD and other causes of cognitive decline who have not been treated with amyloid beta-directed therapy, a negative scan is inconsistent with a neuropathological diagnosis of AD at the time of image acquisition and reduces the likelihood that a patient's cognitive impairment is due to AD. A negative scan result does not preclude the accumulation of amyloid beta in the brain in the future.
Positive VIZAMYL Scan
Positive scans show at least one cortical region with reduction or loss of the normally distinct gray-white matter contrast. These scans have one or more regions with increased cortical gray matter signal (above 50% to 60% peak intensity) and/or reduced (or absent) gray-white matter contrast (white matter sulcal pattern is less distinct). A positive scan may have one or more regions in which gray matter signal is as intense or exceeds the intensity in adjacent white matter.
Specifically, a positive scan would have the following characteristics:
- frontal, lateral temporal, or inferolateral parietal lobes: high intensity seen to the periphery of the brain, with sharp reduction of intensity at the brain margin; sulci may not be distinct due to fill-in by high intensity gray matter resulting in a convex appearance of the surface at the edge of the brain,
or
posterior cingulate and precuneus: gray matter uptake above 50% to 60% of peak intensity; high gray matter intensity that closes the gap between the two hemispheres on coronal view,
or
striatum: intensity above 50% to 60% of peak intensity; gap between thalamus and frontal white matter not distinct.
If any one of the brain regions systematically reviewed for signal intensity is positive in either hemisphere, then the scan is considered positive. Otherwise, the scan is considered negative.
A positive scan establishes the presence of moderate to frequent neuritic plaques. Neuropathological examination has shown that moderate to frequent amyloid beta neuritic plaques are present in patients with AD, but may also be present in patients with other types of neurologic conditions as well as older people with normal cognition.
Figures 1, 2, and 3 provide examples of negative and positive scans.
Figure 1: Axial View of Negative (left) and Positive (right) VIZAMYL Scans. The axial slices that cut through the frontal pole and inferior aspect of the splenium are shown using a rainbow color scale. The left image shows a white matter sulcal pattern at the frontal (f) and lateral temporal (lt) regions with a color intensity that tapers to the periphery, as well as less signal intensity in the striatal region(s). The right image shows absence of the white matter sulcal pattern with intensity radiating to a sharply defined convex edge, as well as more signal intensity in the striatum. In both the frontal and lateral temporal regions, the intensity is higher in the gray matter regions of the right image compared to those of the left image.
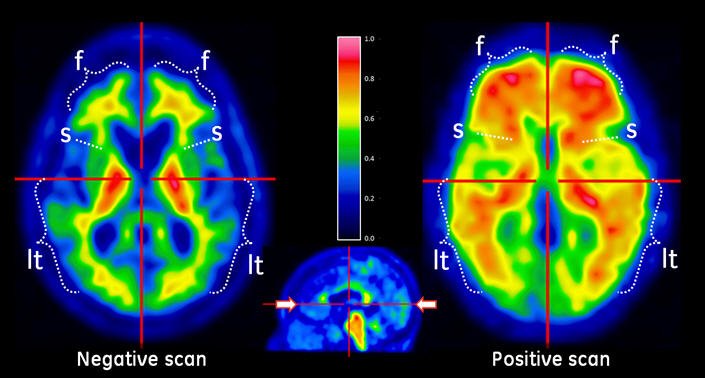
Figure 2: Sagittal View of Negative (left) and Positive (right) VIZAMYL Scans. The sagittal slices are slightly off midline in one hemisphere and shown using a rainbow color scale. In the posterior cingulate (pc) region, which is superior and posterior to the corpus callosum (cc), the left image shows signal intensity below 50% of peak intensity whereas the right image shows intensity above 60% of peak intensity. The pons (p) is set to approximately 90% of the maximum intensity.
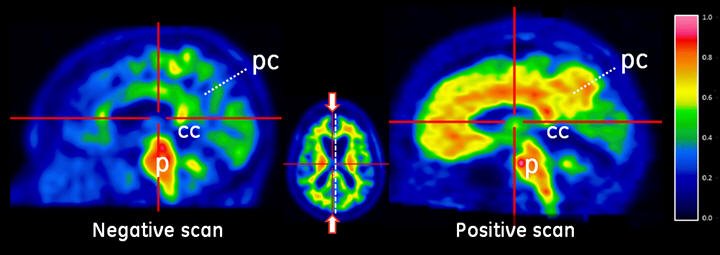
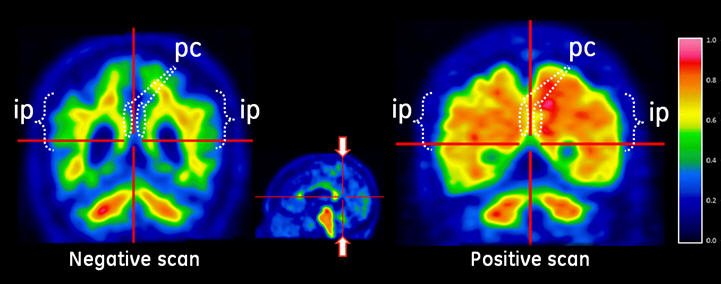
Figure 3: Coronal View of Negative (left) and Positive (right) VIZAMYL Scans. The coronal slices are located posterior to the corpus callosum. The left image shows a white matter sulcal pattern in the inferior parietal (ip) regions that is not evident in the right image. Relative to the left image, the right image shows increased signal intensity in the posterior cinguli (pc) and increased radial extent of high intensity to the lateral surfaces of the parietal lobes particularly evident in the inferior parietal regions.
Quantitative Analysis
Quantification of amyloid beta neuritic plaque levels (e.g., Centiloid scale or standardized uptake value ratio (SUVR)) can be used in conjunction with visual assessment and performed with FDA-authorized software indicated for quantification of brain amyloid PET scans. Refer to the drug manufacturer's training materials for qualitative and quantitative assessment and to the software manufacturers' documentation for software operation.
Radiation Dosimetry
Estimated radiation absorbed doses for adults following intravenous injection of VIZAMYL are shown in Table 1.
Values were calculated from human biodistribution data using OLINDA/EXM software and assuming emptying of the urinary bladder at 3.5-hour intervals.
The whole-body effective dose resulting from administration of 185 MBq (5 mCi) of VIZAMYL to an adult is estimated to be 5.9 mSv. When PET/CT is performed, exposure to radiation will increase by an amount dependent on the settings used in the CT acquisition.
| Organ/Tissue | Absorbed Dose Per Unit Administered Activity (microGy/MBq) |
|---|---|
| Adrenals | 13 |
| Brain | 11 |
| Breasts | 5 |
| Gallbladder wall | 287 |
| Heart wall | 14 |
| Kidneys | 31 |
| Liver | 57 |
| Lower large intestine wall | 42 |
| Lungs | 16 |
| Muscle | 9 |
| Osteogenic cells | 11 |
| Ovaries | 25 |
| Pancreas | 15 |
| Red marrow | 13 |
| Skin | 5 |
| Small intestine wall | 102 |
| Spleen | 15 |
| Stomach wall | 12 |
| Testes | 8 |
| Thymus | 6 |
| Thyroid | 6 |
| Upper large intestine wall | 117 |
| Urinary bladder wall | 145 |
| Uterus | 25 |
| Total body | 12 |
| Effective Dose | 32 (microSv/MBq) |
More about Vizamyl (flutemetamol f-18)
- Compare alternatives
- Side effects
- During pregnancy
- FDA approval history
- Drug class: diagnostic radiopharmaceuticals
- Breastfeeding
Patient resources
Professional resources
Related treatment guides
See also:
Further information
Always consult your healthcare provider to ensure the information displayed on this page applies to your personal circumstances.