Neuraceq Dosage
Generic name: FLORBETABEN F-18 135mCi in 1mL
Dosage form: injection, solution
Drug class: Diagnostic radiopharmaceuticals
Medically reviewed by Drugs.com. Last updated on Jun 26, 2025.
Radiation Safety - Drug Handling
Handle NEURACEQ with appropriate safety measures to minimize radiation exposure during administration.Use waterproof gloves and effective radiation shielding, including lead-glass syringe shields when handling and administering NEURACEQ.
Radiopharmaceuticals, including NEURACEQ, should be used by or under the control of healthcare providers who are qualified by specific training and experience in the safe use and handling of radionuclides, and whose experience and training have been approved by the appropriate governmental agency authorized to license the use of radionuclides.
Recommended Dosing and Administration Instructions
Recommended Dosage
The recommended amount of radioactivity of NEURACEQ is 300 MBq (8.1 mCi) in a total volume of up to 10 mL, administered as a single slow intravenous bolus (6 sec/mL). The maximum mass dose is 30 micrograms. Follow the administration with an intravenous flush of approximately 10 mL of 0.9% sodium chloride injection.
Patient Preparation
Instruct patients to hydrate before and after NEURACEQ administration and to void before imaging and frequently thereafter following NEURACEQ administration.
Administration
- Use aseptic technique and radiation shielding to withdraw and administer NEURACEQ.
- Visually inspect NEURACEQ for particulate matter and discoloration prior to administration. Do not use NEURACEQ if it contains particulate matter or if it is discolored.
- Do not dilute NEURACEQ.
- Measure the activity of NEURACEQ with a dose calibrator immediately prior to injection.
- Verify patency of the indwelling catheter by a test flush with 0.9% sodium chloride injection prior to administration of NEURACEQ.
- Dispose of unused product in a safe manner in compliance with applicable regulations
Image Acquisition Guideline
- Position the patient supine with the head positioned to center the brain, including the cerebellum, in the PET scanner field of view. Tape or other flexible head restraints may be employed to reduce head movement.
- Acquire 15-minute to 20-minute PET images starting 45 minutes to 130 minutes after NEURACEQ administration.
- Image reconstruction should include attenuation correction with resulting transaxial pixel sizes between 2 mm and 3 mm.
Image Display and Interpretation
Image Display
- Display images in the transaxial orientation using gray scale or inverse gray scale. The sagittal and coronal planes may be used for additional orientation purposes.
- CT or MR images may be helpful for anatomic reference purposes. However, visual assessment should be performed using the axial planes according to the recommended reading methodology.
- Locate regions which ‘anatomically’ correspond to white matter structures (e.g., the cerebellar white matter or the splenium) for orientation.
- Review images in a systematic manner, starting with the cerebellum and scrolling up through the lateral temporal and frontal lobes, the posterior cingulate cortex/precuneus, and the parietal lobes.
Visual Assessment
NEURACEQ images should be interpreted only by readers who successfully complete training provided by the manufacturer. The reader training can be accessed here: https://www.neuraceqreadertraining.com/learn.
Perform image interpretation independently of the patient’s clinical features, relying on the recognition of unique image features.
Interpret NEURACEQ images based upon the distribution of signal intensity within the cerebral cortex by comparing the signal intensity in the cortical gray matter and the adjacent white matter. Signal intensity in the gray matter is assessed in the following four brain regions: the temporal lobes, the frontal lobes, the posterior cingulate cortex/precuneus, and the parietal lobes. For a gray matter cortical region to be assessed as showing increased signal, the majority of slices from the respective region must be affected. The signal intensity in the cerebellum does not contribute to the scan interpretation. For example, a positive scan may show retained cerebellar gray-white contrast even when the cortical gray-white contrast is lost.
Some scans may be difficult to interpret due to image noise, atrophy with a thinned cortex, or image blur. If co-registered computerized tomography (CT) or magnetic resonance (MR) images are available, the CT/MR images may be used to clarify the relationship of the NEURACEQ uptake and the gray matter anatomy.
Negative NEURACEQ Scan
Signal intensity in gray matter is lower than in white matter in all four brain regions (no amyloid beta deposition).
A negative scan indicates sparse to no amyloid beta neuritic plaques. In patients being evaluated for AD and other causes of cognitive decline who have not been treated with amyloid beta-directed therapy, a negative scan is inconsistent with a neuropathological diagnosis of AD at the time of image acquisition and reduces the likelihood that a patient’s cognitive impairment is due to AD. A negative scan result does not preclude the accumulation of amyloid beta in the brain in the future.
Positive NEURACEQ Scan
Smaller area(s) of signal intensity equal to or higher than that present in white matter extending beyond the white matter rim to the outer cortical margin involving the majority of the slices within at least one of the four brain regions (“moderate” amyloid beta deposition), or a large confluent area of signal intensity equal to or higher than that present in white matter extending beyond the white matter rim to the outer cortical margin and involving the entire region including the majority of slices within at least one of the four brain regions (“pronounced” amyloid beta deposition). There is no known clinical or histopathologic correlation distinguishing “moderate” from “pronounced” amyloid beta deposition.
A positive scan establishes the presence of moderate to frequent amyloid beta neuritic plaques. Neuropathological examination has shown that moderate to frequent amyloid beta neuritic plaques are present in patients with AD but may also be present in patients with other types of neurologic conditions as well as older people with normal cognition.
Examples of positive and negative scans for each of the four brain regions are illustrated in Figure 1.
Figure 1 Axial view of negative (top row) and positive (bottom row) Neuraceq PET scans
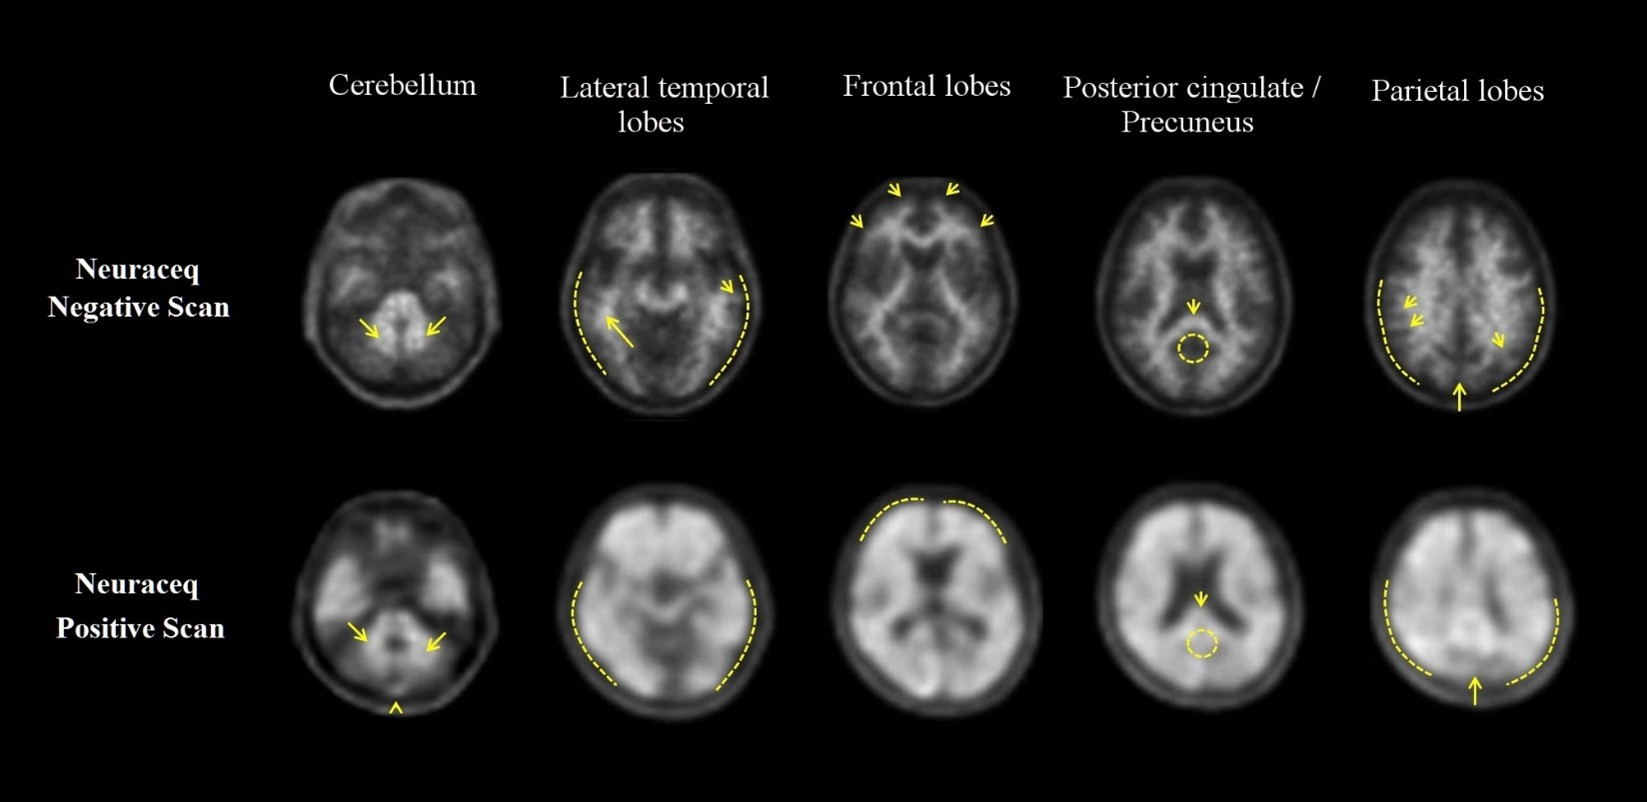
Cerebellum:A contrast between the white matter (arrows) and gray matter is seen in both negative and positive scans. Extracerebral signal intensity in the scalp and posterior sagittal sinus (arrowhead) can be seen. Lateral temporal lobes:Spiculated or “mountainous” appearance of the white matter (arrows) is seen in the negative scan, and the signal does not reach the outer rim of the brain (dashed line) due to lower signal intensity in the gray matter. The positive scan shows a “plumped”, smooth appearance of the outer border of the brain parenchyma (dashed line) due to signal intensity in the gray matter. Frontal Lobes:Spiculated appearance of the white matter in the frontal lobes (arrows) is seen in the negative scan. The positive scan shows “plumped”, smooth appearance in these regions due to the increased gray matter signal intensity (dashed line). Posterior cingulate/precuneus:Regions adjacent and posterior to the splenium (arrow) appear as a hypo-intense “hole” (circle) in the negative scan, whereas this hole is “filled-up” (circle) in the positive scan. Parietal lobes:In the negative scan, the midline between the parietal lobes can be easily identified (long arrow); white matter has a spiculated appearance (short arrow) with low signal near the outer rim of the brain (dashed line). In the positive scan, the midline between the parietal lobes is much thinner. The cortical areas are “filled-up” and are smooth in appearance as signal intensity extends to the outer rim of the brain.
Quantitative Analysis
Quantification of amyloid beta neuritic plaque levels (e.g., Centiloid scale or standardized uptake value ratio (SUVR)) can be used in conjunction with visual assessment and performed with FDA-authorized software indicated for quantification of brain amyloid beta PET scans. Refer to the drug manufacturer’s training materials for qualitative and quantitative assessment and software manufacturers’ documentation for software operation.
Radiation Dosimetry
Estimated radiation absorbed doses for adults from intravenous injection of Neuraceq are shown in Table 1.
| Organ/Tissue | Mean Absorbed Radiation Dose per Unit Administered Activity [microGy/MBq] |
| Adrenals | 13 |
| Brain | 13 |
| Breasts | 7 |
| Gallbladder Wall | 137 |
| Heart Wall | 14 |
| Kidneys | 24 |
| Liver | 39 |
| Lower Large Intestine-Wall | 35 |
| Lungs | 15 |
| Muscle | 10 |
| Osteogenic Cells | 15 |
| Ovaries | 16 |
| Pancreas | 14 |
| Red Marrow | 12 |
| Skin | 7 |
| Small Intestine | 31 |
| Spleen | 10 |
| Stomach Wall | 12 |
| Testes | 9 |
| Thymus | 9 |
| Thyroid | 8 |
| Upper Large Intestine-Wall | 38 |
| Urinary Bladder Wall | 70 |
| Uterus | 16 |
| Total Body | 11 |
| Effective Dose (microSv/MBq) | 19 |
The whole-body effective dose resulting from administration of 300 MBq (8.1 mCi) of NEURACEQ in adults is estimated to be 5.8 mSv. When PET/CT is performed, exposure to radiation will increase by an amount dependent on the settings used in the CT acquisition.
More about Neuraceq (florbetaben f-18)
- Check interactions
- Compare alternatives
- Side effects
- During pregnancy
- FDA approval history
- Drug class: diagnostic radiopharmaceuticals
- Breastfeeding
Patient resources
Professional resources
Related treatment guides
See also:
Further information
Always consult your healthcare provider to ensure the information displayed on this page applies to your personal circumstances.