Tauvid Dosage
Generic name: Flortaucipir F-18 100mCi in 1mL
Dosage form: injection, solution
Drug class: Diagnostic radiopharmaceuticals
Medically reviewed by Drugs.com. Last updated on Feb 5, 2024.
Radiation Safety - Drug Handling
TAUVID is a radioactive drug. Only authorized persons qualified by training and experience should receive, use, and administer TAUVID. Handle TAUVID with appropriate safety measures to minimize radiation exposure during administration [see Warnings and Precautions (5.3)]. Use waterproof gloves and effective shielding, including syringe shields, when preparing and handling TAUVID.
Recommended Dosage and Administration Instructions
Recommended Dose
The recommended amount of radioactivity to be administered for PET imaging is 370 MBq (10 mCi), administered as an intravenous bolus injection in a total volume of 10 mL or less.
Preparation and Administration
- Assessment of pregnancy status is recommended in females of reproductive potential before administering TAUVID.
- Use aseptic technique and radiation shielding during the preparation and administration of TAUVID [see Dosage and Administration (2.1)].
- Visually inspect the radiopharmaceutical solution prior to administration. Do not use it if it contains particulate matter or if it is discolored (TAUVID is a clear, colorless solution).
- TAUVID may be diluted aseptically with 0.9% Sodium Chloride Injection to a maximum dilution of 1:5 by the end-user. Diluted product should be used within 4 hours of dilution and prior to product expiry.
- Assay the dose in a suitable dose calibrator prior to administration.
Image Acquisition
Starting approximately 80 minutes after the TAUVID intravenous injection, obtain a 20-minute PET image with the patient supine. Position the head to center the brain (including the cerebellum) in the PET scanner field of view. Tape or other flexible head restraints may be used to reduce head movement.
Image Display
The goal of the read is to identify and locate areas of flortaucipir activity in the neocortex that are greater than the background activity (background activity is defined as up to 1.65-fold the measured cerebellar average). For optimal display, select a color scale with a rapid transition between two distinct colors and adjust the scale so that the transition occurs at the 1.65-fold threshold. Examine the posterolateral temporal (PLT), occipital, parietal, and frontal regions bilaterally. Neocortical activity in either hemisphere contributes to image interpretation. Activity in white matter or regions outside the brain does not contribute to image interpretation. To help identify the PLT, consider subdividing the temporal lobe into four quadrants as instructed below. Activity in the anterior and medial temporal lobe does not contribute to image interpretation of a positive TAUVID pattern.
Image Display and Orientation
Display images in the transverse, sagittal, and coronal planes. Reorient images to remove head tilt in the transverse and coronal plane. Use a sagittal slice just off the midline to align the inferior frontal and inferior occipital poles in the horizontal plane.
Select and Adjust the Color Scale
To create a visual threshold for positivity:
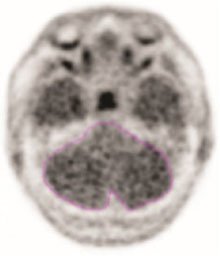
- Draw a region of interest around the cerebellum in the transverse plane.
- Select the plane to go through the cerebellum at the maximum cross-sectional area of the cerebellum.
- Record the mean activity or cerebellar counts (MCC). The region of interest should be drawn with the scan in gray scale and in the transverse plane as seen in the example in Figure 1.
Figure 1: Example of Cerebellar Region of Interest
- Select a color scale for image display that has a rapid transition between two distinct colors in the general range of 25% to 60% of maximum intensity.
- Set the upper contrast value (UCV) of the color scale. Use the following formula to set the visual threshold of 1.65 x MCC to match the rapid transition in the color scale:
| UCV = (MCC x 1.65) x (100% / % level of color transition) |
If additional guidance on image display is needed, refer to the TAUVID User Guide for PET Image Display available by request from the manufacturer.
Preparation for Image Interpretation
- Before interpreting the image, review the brain to determine the lobar anatomy. Interpret the images by first evaluating the temporal lobes, followed by occipital, parietal, and frontal lobes bilaterally.
- To evaluate the temporal lobes, subdivide them into four quadrants by placing the horizontal crosshair immediately posterior to the brainstem nuclei and then scrolling inferiorly to place the vertical crosshair through the widest portion of the temporal pole, thus obtaining the anterolateral temporal (ALT), anterior mesial temporal (AMT), posterolateral temporal (PLT) and posterior mesial temporal (PMT) quadrants. See Figure 2 for an example (the left and right image panels show the same scan in two different color scales).
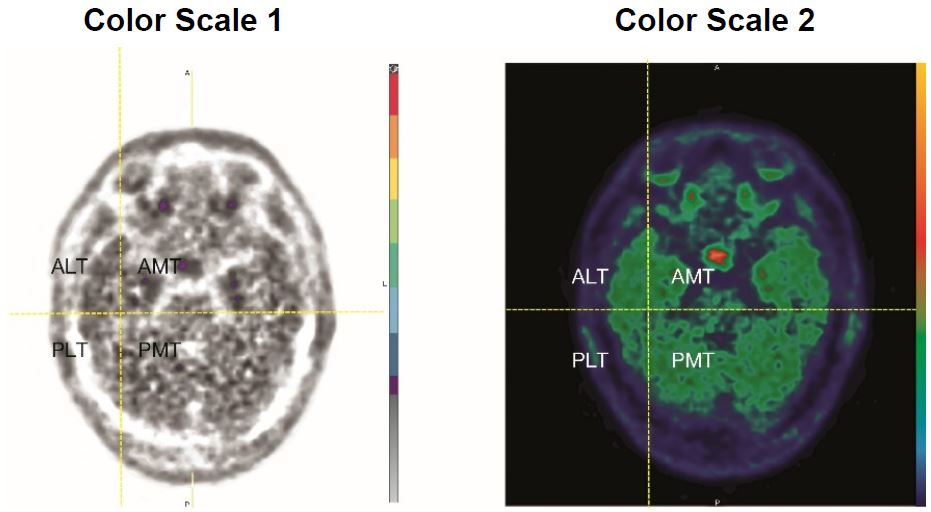
Image Interpretation
Interpret TAUVID imaging independently of the patient's clinical features and other imaging.
Interpret the PET TAUVID images based upon the pattern and density of the radioactive signal within the neocortical gray matter (not within white matter or in regions outside of the brain). Only uptake of tracer in the neocortical grey matter regions should contribute to scan interpretation.
Off-target binding may be seen in the choroid plexus, striatum, and brainstem nuclei. Small foci of noncontiguous tracer uptake may lead to false positive interpretation. Interpret scans that have isolated or noncontiguous, small foci in any region with caution. Some scans may be difficult to interpret due to image noise or motion artifact. For cases where there is uncertainty as to the location of neocortical uptake, use co-registered anatomical imaging to improve localization of uptake.
Positive TAUVID Scan
A positive scan shows increased neocortical activity in posterolateral temporal (PLT), occipital, or parietal/precuneus region(s), with or without frontal activity. Neocortical activity in either hemisphere can contribute to identification of the positive pattern. A positive scan supports the presence of widely distributed tau neuropathology (B3 tau pathology). See Figure 3 for examples (the left and right image panels show the same scans in two different color scales) [see Warnings and Precautions (5.1)].
Negative TAUVID Scan
A negative scan shows no increased neocortical activity, or shows increased neocortical activity isolated to the mesial temporal, anterolateral temporal, and/or frontal regions. See Figure 4 for examples (the left and right image panels show the same scans in two different color scales) [see Warnings and Precautions (5.1)].
Figure 3: Positive Scan Examples
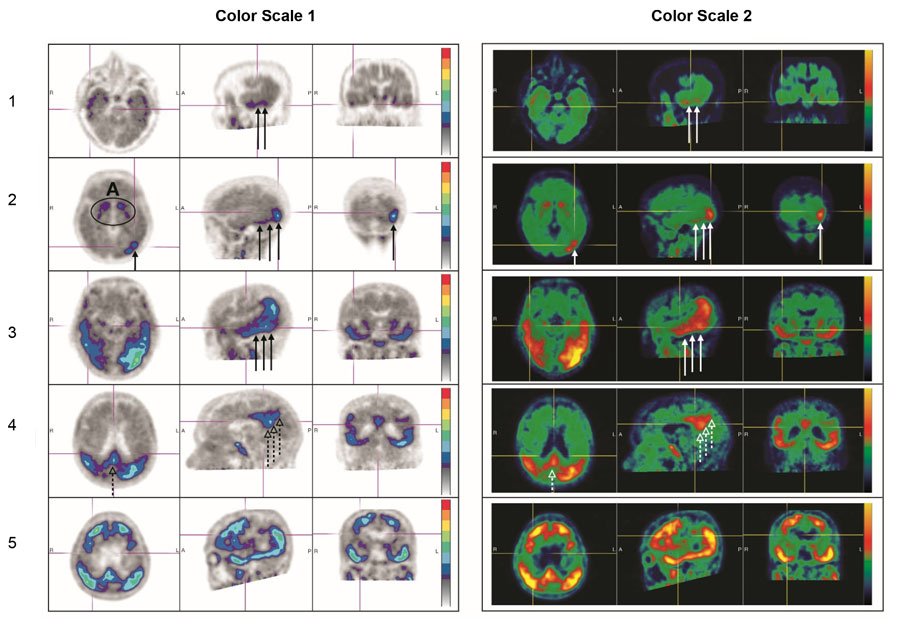
A: Off target binding in the striatum.
Row 1: Example of a patient with increased uptake in PLT.
Row 2: Example of a patient with increased uptake in PLT and occipital regions.
Rows 3 and 4: Example of a patient with increased neocortical activity in PLT, occipital lobe (solid arrows) and precuneus (dashed arrows) (row 3: level of temporal lobes, row 4: level of parietal/precuneus).
Row 5: Example of a patient with increased neocortical activity in medial prefrontal/cingulate, lateral prefrontal, PLT, parietal, occipital and precuneus regions.
Figure 4: Negative Scan Examples
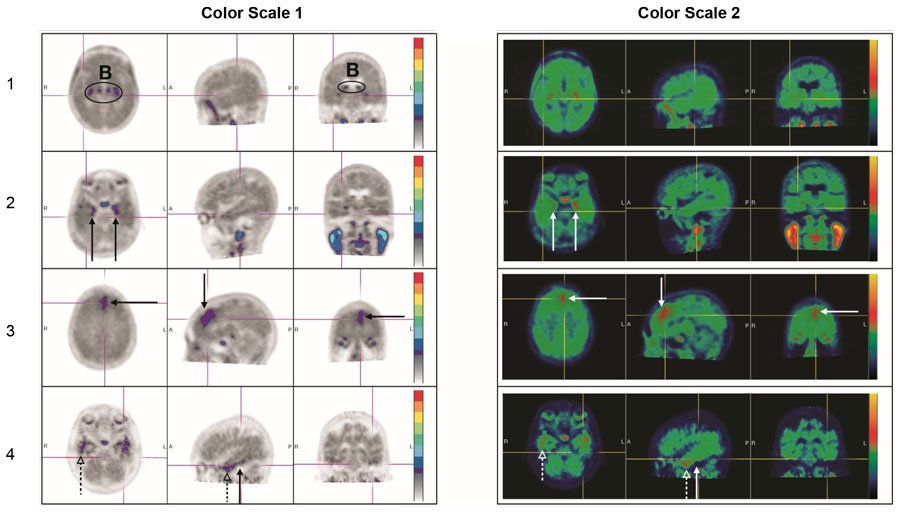
B: Off target binding in the choroid plexus or brainstem nuclei.
Row 1: Example of a patient with no increased neocortical activity (activity is similar in intensity to cerebellar reference region).
Row 2: Example of a patient with increased activity isolated to MTL.
Row 3: Example of a patient with increased neocortical activity isolated to frontal lobe.
Row 4: Example of a patient with small isolated foci of non-contiguous and variable uptake in the PLT (solid arrows); increased activity in the ALT (dashed arrows). This pattern may also be seen in the occipital or parietal region.
Radiation Dosimetry
Radiation absorbed dose estimates are shown in Table 1 for organs and tissues of adults from intravenous administration of TAUVID. The effective radiation dose resulting from administration of 370 MBq (10 mCi) of TAUVID to an adult weighing 70 kg is estimated to be 8.7 mSv. Critical organs include the upper large intestinal wall, small intestine, and liver. When PET/CT is performed, exposure to radiation will increase in an amount dependent on the settings used in the CT acquisition.
|
a Assumed radiation weighting factor, wr, (formerly defined as quality factor, Q) of 1 for conversion of absorbed dose (Gray or rads) to dose equivalent (Sieverts or rem) for F 18. To obtain radiation absorbed dose in rad/mCi from above table, multiply the dose in μGy/MBq by 0.0037 (e.g., 14 μGy/MBq x 0.0037 = 0.0518 rad/mCi). |
|
| Organ/Tissue | Mean Absorbed Dose Per Unit Administered Activity (μGy/MBq) |
| Adrenal glands | 14 |
| Brain | 8 |
| Breasts | 7 |
| Gallbladder wall | 38 |
| Lower large intestine wall | 35 |
| Small intestine wall | 85 |
| Stomach wall | 13 |
| Upper large intestine wall | 96 |
| Heart wall | 30 |
| Kidneys | 40 |
| Liver | 57 |
| Lungs | 34 |
| Muscle | 9 |
| Ovaries | 21 |
| Pancreas | 14 |
| Red bone marrow | 10 |
| Osteogenic cells | 12 |
| Skin | 6 |
| Spleen | 10 |
| Testes | 7 |
| Thymus gland | 9 |
| Thyroid | 7 |
| Urinary bladder wall | 38 |
| Uterus | 18 |
| Total body | 12 |
| Effective dose (μSv/MBq)a | 24 |
More about Tauvid (flortaucipir F 18)
- Check interactions
- Compare alternatives
- Side effects
- During pregnancy
- FDA approval history
- Drug class: diagnostic radiopharmaceuticals
Patient resources
Professional resources
Related treatment guides
Further information
Always consult your healthcare provider to ensure the information displayed on this page applies to your personal circumstances.